
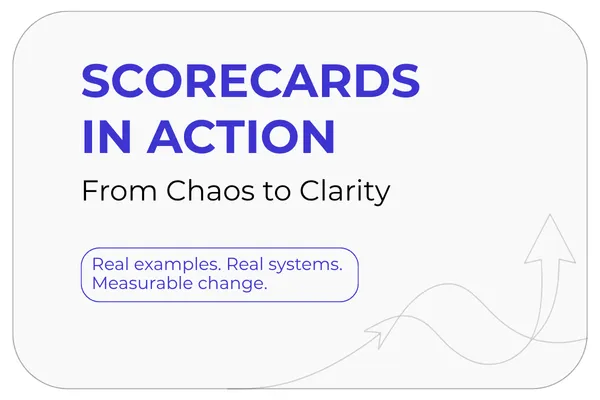
Case Study — Scorecards in Action: From Chaos to Clarity
Context
A 40‑person SaaS company had 20+ dashboards but no clarity. Meetings dragged, metrics conflicted, and every department defended its own view. Leadership reset: what if we had one page everyone could read in 5 minutes?
Baseline (Before Scorecard)
Dashboards in use: 23 (Mixpanel, GA, CRM, custom BI)
Meeting time: 2.5h average weekly ops meeting
Decisions/week: 1–2 (often deferred)
North Star awareness: < 30% of staff could name it
Confusion isn’t free—it costs velocity.
What We Changed (Mon → Fri)
Monday — Choose the North Star
Picked “% of trials reaching first‑aha in 24h” as compounding outcome
Agreed on two health metrics: refund rate < 3%; support SLA < 2h median
Tuesday — Pick levers
3 leading indicators: % routed correctly; time‑to‑route; click‑to‑trial
Each assigned an owner (initials visible on scorecard)
Wednesday — Draft the scorecard
One Notion table (North Star • Leading • Health)
Conditional colors (green/yellow/red)
Linked demo URLs for evidence
Thursday — Dry run
Owners updated metrics by 4pm
Producer assembled screenshots and logs
Friday — Decision meeting
15‑minute stand‑up
Each owner showed evidence; team decided on next week’s changes
Results (After 2 Weeks)
Dashboards in use: cut from 23 → 5 supporting tools
Meeting time: ↓ to 22 minutes average
Decisions/week: ↑ to 5–6, logged with demo links
North Star awareness: ↑ to 92% of staff could name it
Clarity scales. The scorecard ended turf wars.
Evidence (What We Showed)
Scorecard screenshot: one page with NS, levers, health
Before/after agenda: 2.5h ops deck vs 15‑min scorecard ritual
Clip: Friday stand‑up excerpt (3 min, evidence shown)
What We’d Change Next Time
Add “decision rule” column to make Friday faster
Automate pulling refund % from Stripe; manual was error‑prone
Move scorecard update deadline to Thursday noon to avoid Friday rush
Playbook You Can Copy (5 steps)
Pick one North Star. Compounding outcome only.
Limit levers to 3–5. Assign owners.
Add 2–3 health metrics. Guardrails matter.
Make it visual. Colors + links beat long decks.
Ritualize Friday. Evidence, decision, one learning.
Method Notes & Data Fingerprint
Window: 2 weeks post‑scorecard
Team size: 40; cross‑functional SaaS company
Traffic: ~3,800 sessions/week; ~650 trial starts
Privacy: PII masked; evidence links anonymized
What to Do Next (Pick Your Path)
Open the Picker→ We’ll map you to Book, $97 Challenge, or Toolkits
Try the 7‑Day Challenge → Your $97 becomes credit toward a Toolkit
Get the Toolkit → Scorecard templates (Notion, GHL, Sheets)
